R in Healthcare @ SWICA, Winterthur
Switzerland has some of the best health outcomes in the world — and one of the most expensive systems to run. Making better use of health data is central to improving population health and keeping costs in check, and R is playing a growing role on both sides of that equation. For our September meetup, we looked at R and healthcare from three angles: how SWICA, a major Swiss health insurer, shifts towards Value-Based Healthcare, how the Swiss Health Observatory (Obsan) plans and allocates resources across cantons, and how Swisstransplant, a national foundation, uses statistical modelling to understand and predict organ transplants.
Around 60 R-enthusiasts and members of the Zurich R User Group gathered in Winterthur for the evening. A big thank you goes to SWICA for hosting us at the Hotel Banana City in Winterthur, and to Aurélien and Sereina for leading the organization of the evening.
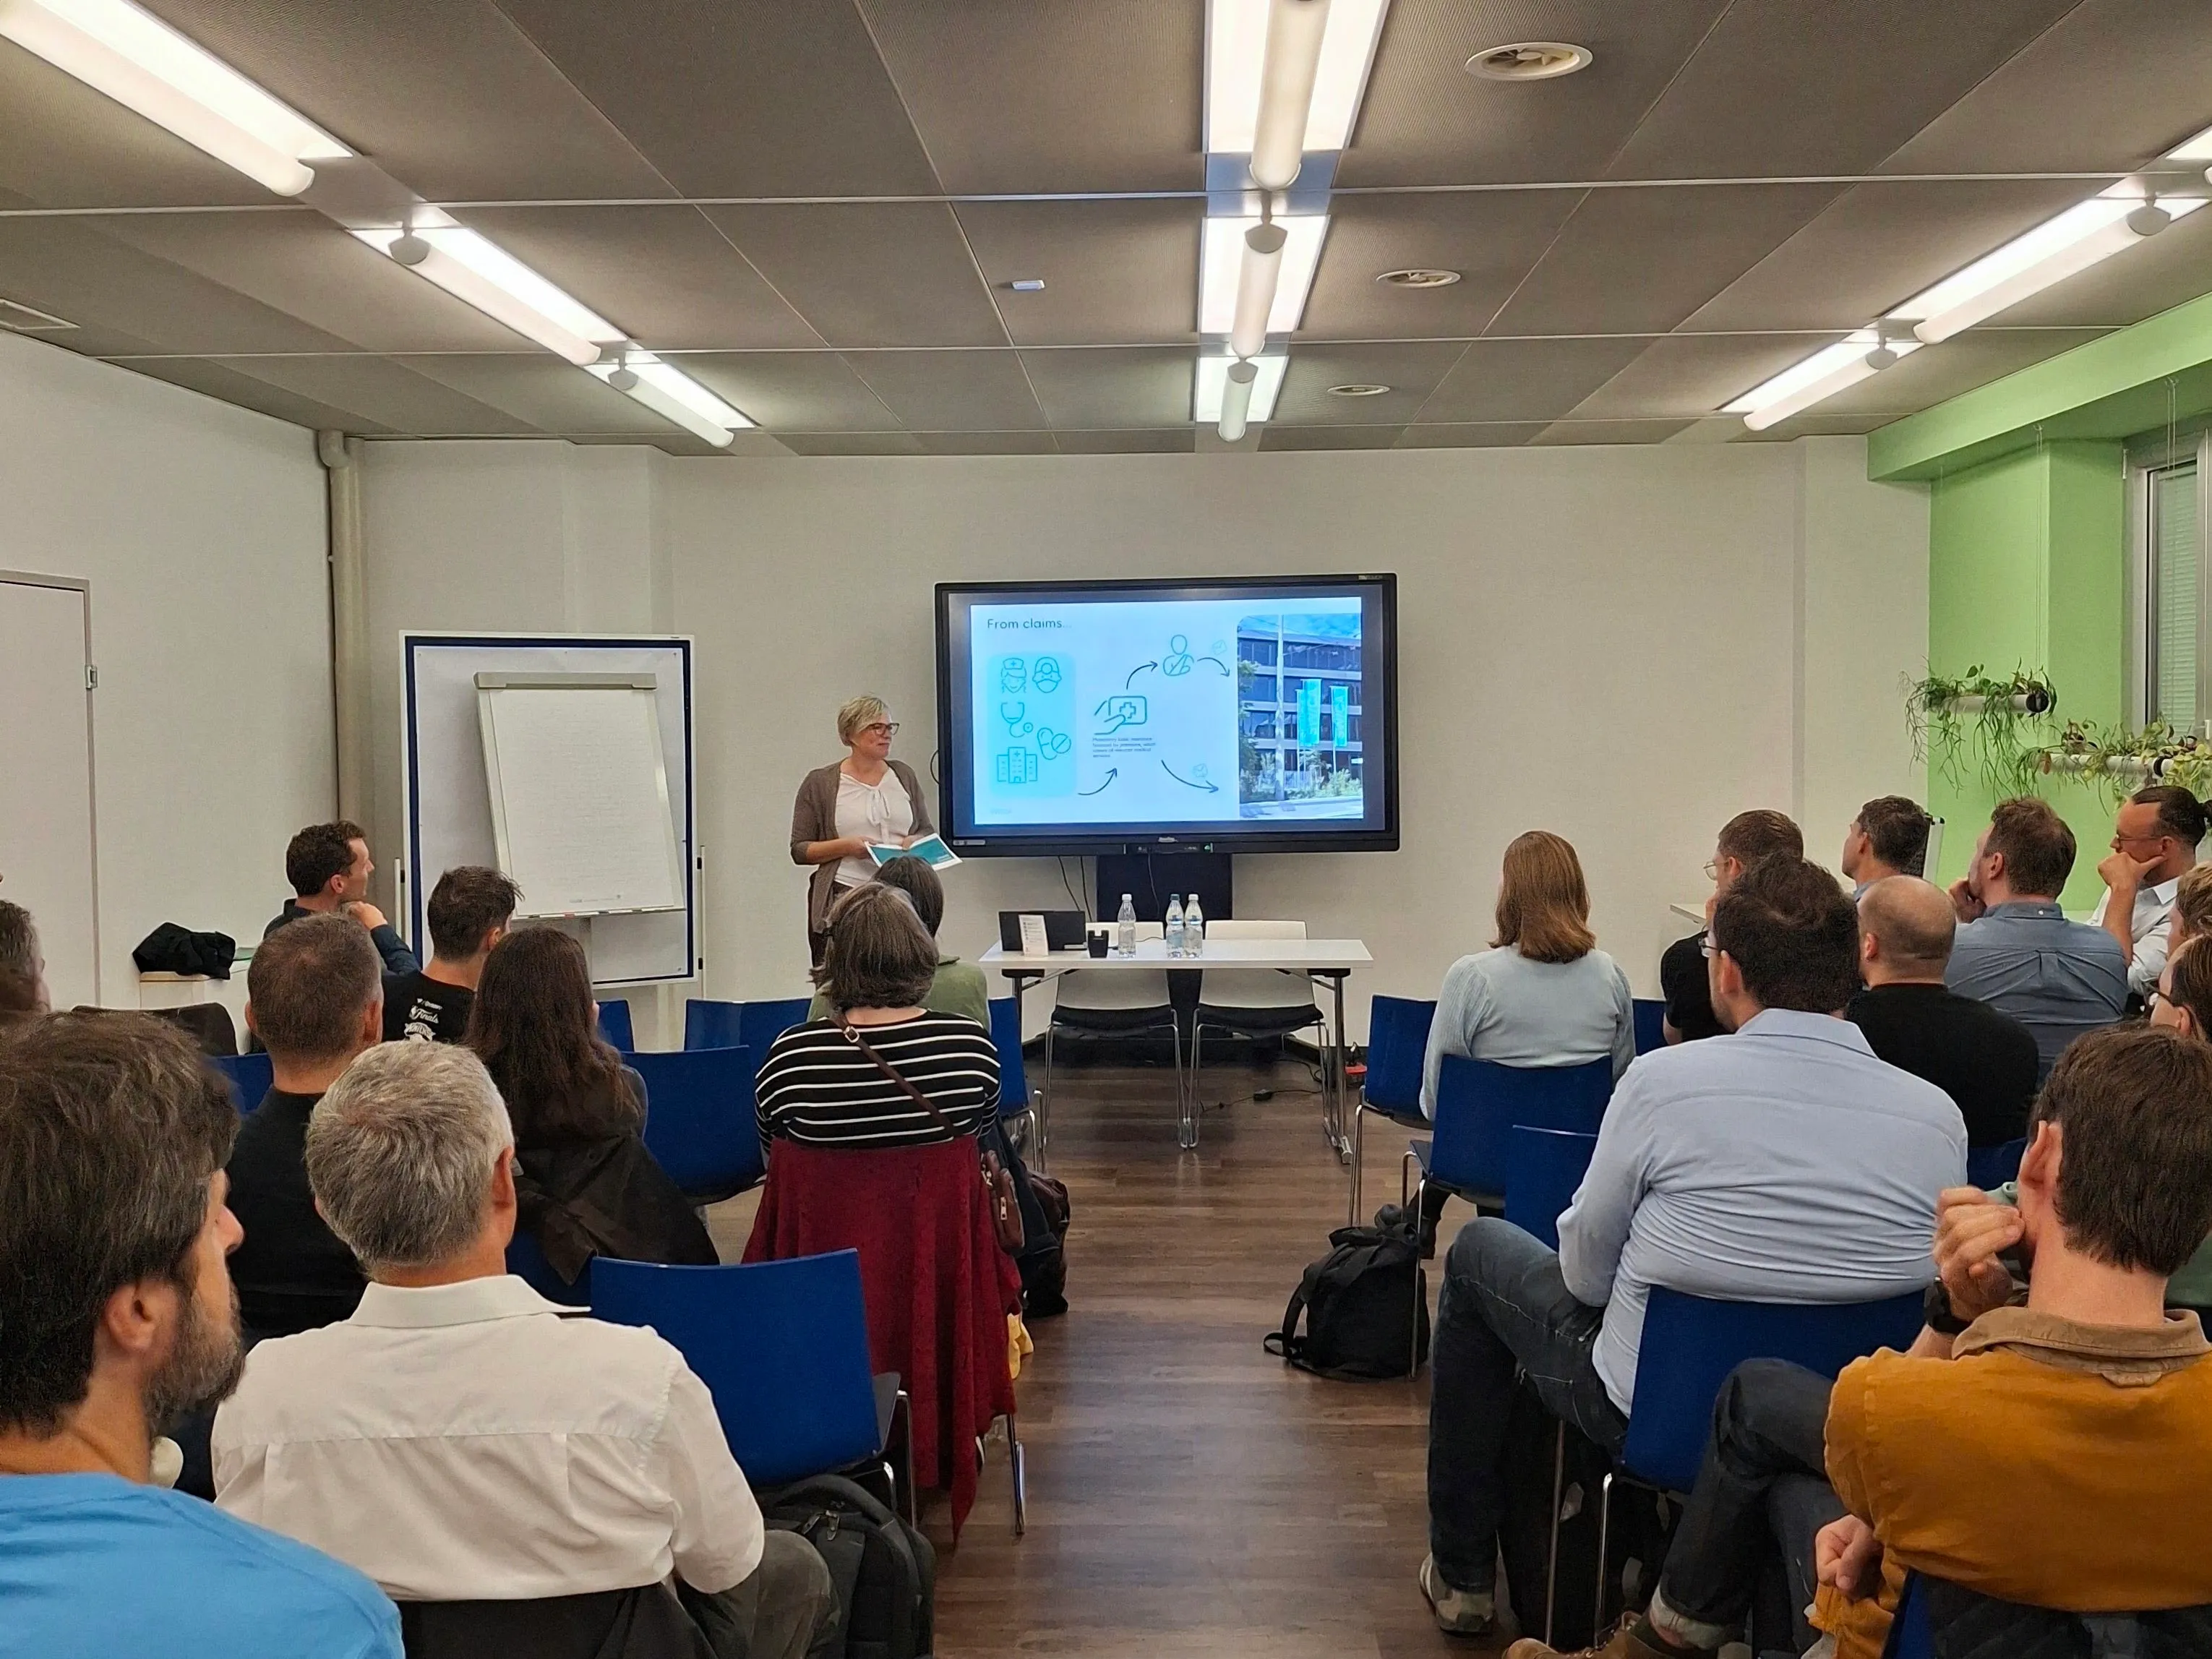
R for an efficient and qualitative health care system (Eva Blozik, SWICA)
Eva Blozik, Head of Healthcare Management at SWICA, opened the evening with the insurer’s perspective on how data analysis drives Value Based Healthcare. Her team combines public health evaluations, in-house analyses, and economic analyses on top of a shared data warehouse, with R playing an important role in the analytical pipeline.
R for health policy planning — from Copy-Paste to Pipelines (Jonathan Zufferey & Reto Jörg, Obsan)
Jonathan Zufferey and Reto Jörg from the Swiss Health Observatory (Obsan) walked us through two projects that show how R is reshaping health policy analytics in Switzerland.
The first was Obsan’s cantonal health reports based on the Swiss Health Survey. What used to be a manual chain of SAS exports, Excel copy-paste and Word assembly — repeated for every canton — is now a fully integrated R workflow that produces both a web output and a PDF report from the same source. Jonathan took us through the transition from static, manual document assembly to an end-to-end reproducible publishing pipeline.
The second project was the Primary Care Monitoring System, a Floating Catchment Area (FCA) model of regional disparities in access to primary care. Provider capacity comes from health insurance claims, demand is modelled from population and commuter flows, and accessibility is derived from road-network travel times — with DuckDB doing the heavy lifting. Reto mentioned the challenges of working with a pipeline combining huge tariff data with distance information as a basis for spatial analysis of access to care (10 billion distances in ~ 40’000 parquet files). Their solution: a pipeline built around duckdb + DBI, which processes large datasets locally without loading everything into R’s memory.
👉 Have a look at the Cantonal Health Reports here
👉 Link to the slides here
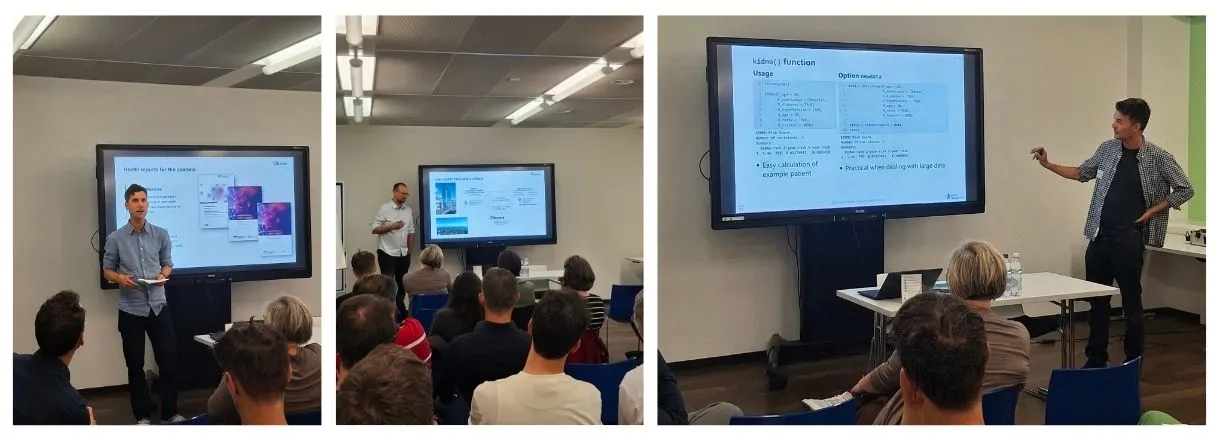
R for predicting kidney transplant success (Simon Schwab, Swisstransplant)
Simon Schwab closed the technical part of the evening with the KIDMO project (Kidney Prediction Model) at Swisstransplant. In 2025, 292 deceased-donor kidney transplants were performed in Switzerland, while more than 880 patients remained on the national waiting list at year-end. Even with excellent overall outcomes, graft loss remains a major concern — and a good target for statistical prediction.
Simon walked us through the model development and validation pipeline, and showed how a clinical prediction model can be turned into a practical tool: an R package plus an online risk calculator built with Shiny, Quarto and Posit Connect Cloud. He shared his experience on working with the tool and the value of interpreting the predictions together with physicians, and gave us valuable insight on finding the right balance between medical relevance and statistical accuracy.
👉 Link to the slides here
Apéro & Networking
After the talks, we moved to our traditional apéro — the part of every ZRUG evening where the actual bandwidth between attendees really opens up.
Thanks
Thanks again to SWICA for hosting and sponsoring the evening, to Eva Blozik, Jonathan Zufferey, Reto Jörg and Simon Schwab for their talks, and to everyone who came out to Winterthur. See you at the next one!